Pre-Processing
Filters
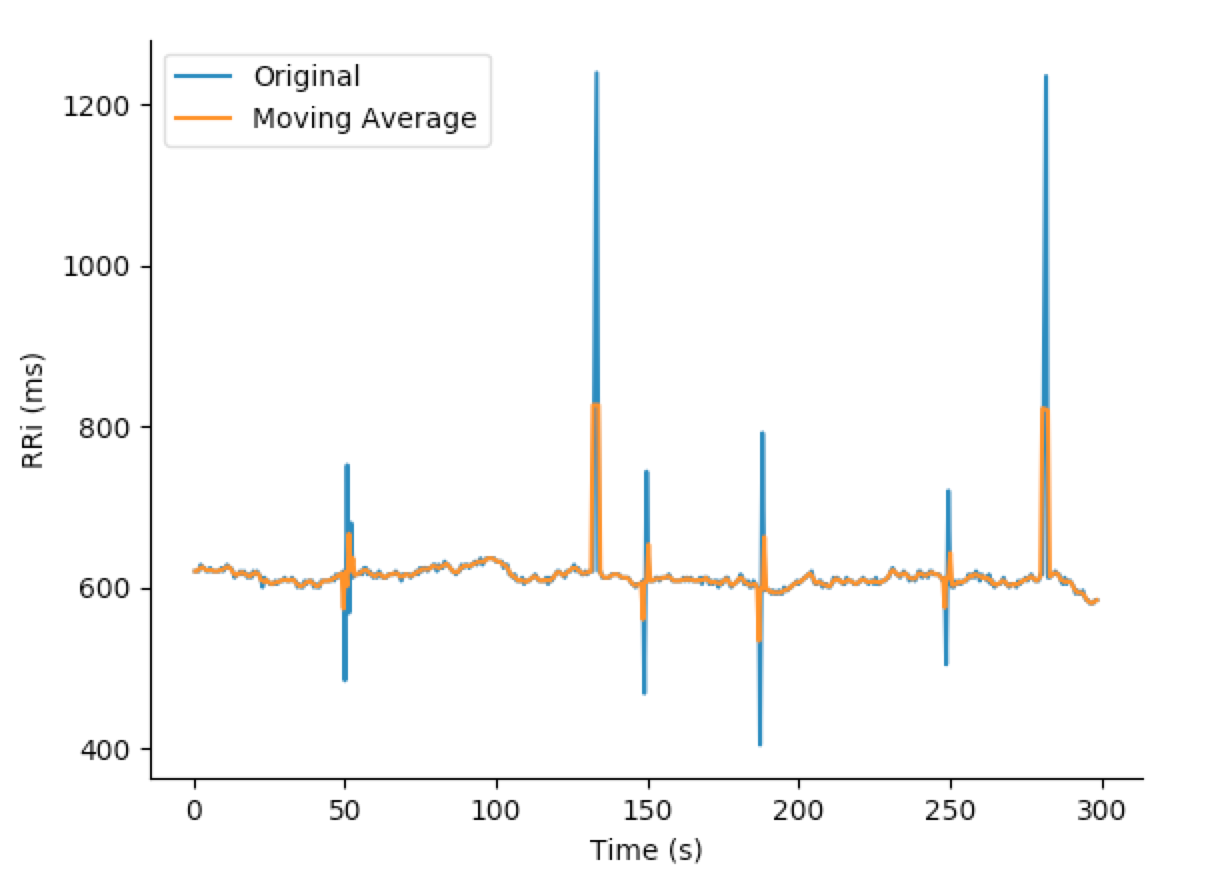
Moving Average
from hrv.filters import moving_average
filt_rri = moving_average(rri, order=3)

fig, ax = rri.plot()
filt_rri.plot(ax=ax)
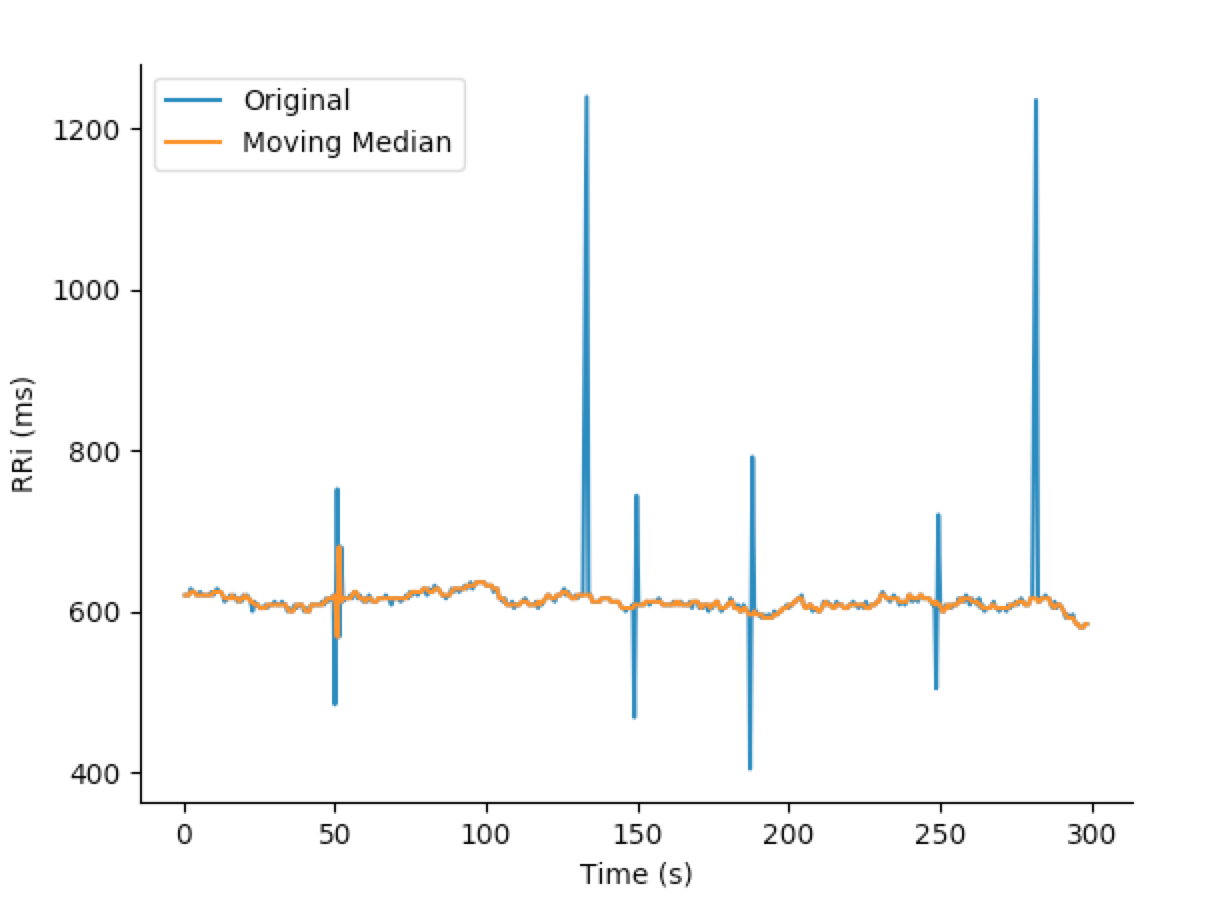
Moving Median
from hrv.filters import moving_median
filt_rri = moving_median(rri, order=3)

fig, ax = rri.plot()
filt_rri.plot(ax=ax)
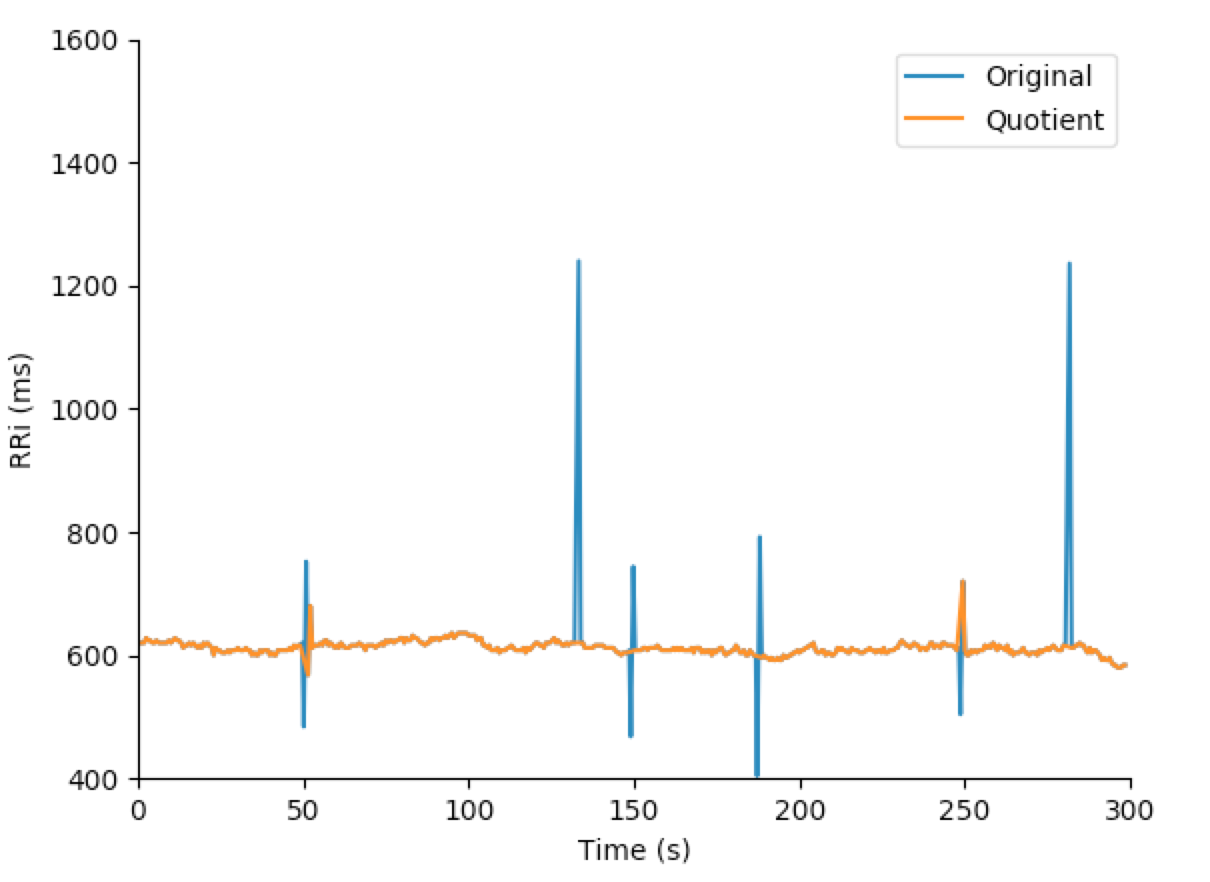
Quotient
from hrv.filters import quotient
filt_rri = quotient(rri)

fig, ax = rri.plot()
filt_rri.plot(ax=ax)
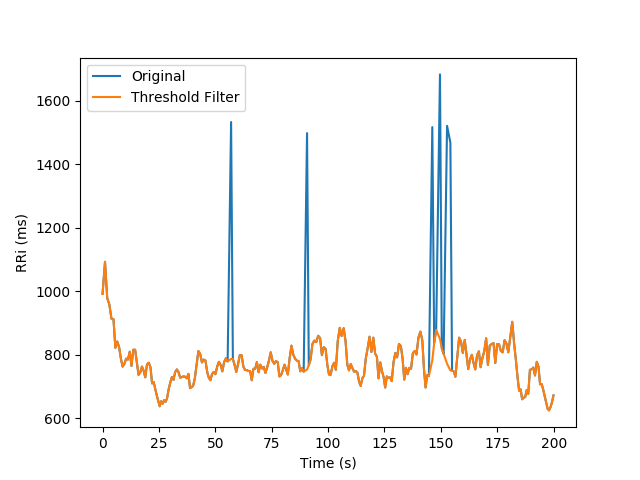
Threshold Filter
This filter is inspired by the threshold-based artifact correction algorithm offered by kubios <sup>®</sup> . To elect outliers in the tachogram series, each RRi is compared to the median value of local RRi (default N=5). All the RRi which the difference is greater than the local median value plus a threshold is replaced by cubic interpolated RRi.
The threshold filter has five pre-defined strength values:
- Very Low: 450ms
- Low: 350ms
- Medium: 250ms
- Strong: 150ms
- Very Strong: 50ms
It also accepts custom threshold values (in milliseconds). The following snippet shows the ectopic RRi removal:
from hrv.filters import threshold_filter
filt_rri = threshold_filter(rri, threshold='medium', local_median_size=5)

fig, ax = rri.plot()
filt_rri.plot(ax=ax)
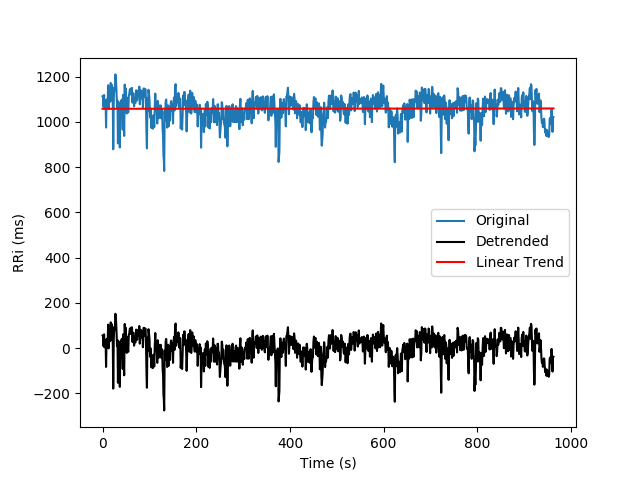
Detrending
The hrv module also offers functions to remove the non-stationary trends from the RRi series. It allows the removal of slow linear or more complex trends using the following approaches:
Polynomial models
Given a degree a polynomial filter is applied to the RRi series and subtracted from the tachogram
from hrv.detrend import polynomial_detrend

rri_detrended = polynomial_detrend(rri, degree=1)

fig, ax = rri.plot()
rri_detrended.plot(ax, color='k')
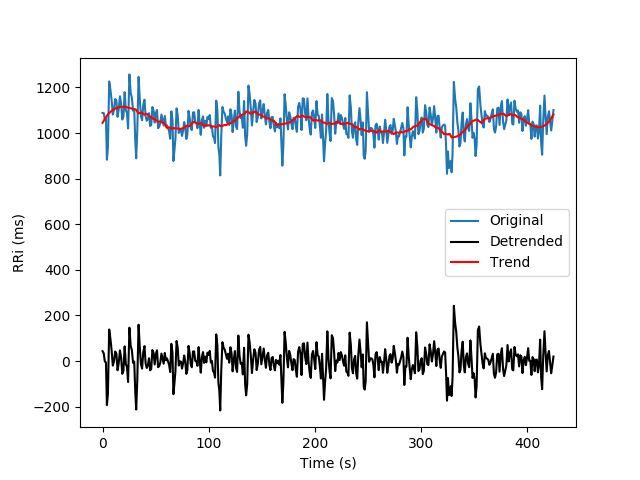
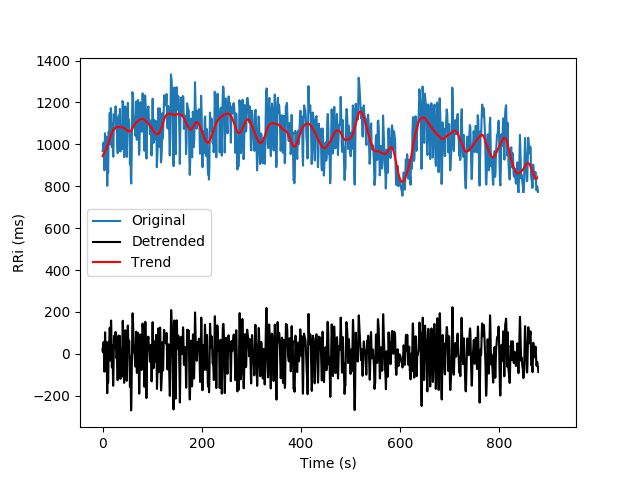
Smoothness priors
Developed by Tarvainen et al, allow the removal of complex trends. Visit here for more information.
It worth noticing that the detrended RRi with the Smoothness priors approach is also interpolated
and resampled using frequency equals to `fs`.
from hrv.detrend import smoothness_priors

rri_detrended = smoothness_priors(rri, l=500, fs=4.0)

fig, ax = rri.plot()
rri_detrended.plot(ax, color='k')
Note: this approach depends on a numpy matrix inversion and due to floating-point precision it might present round-off errors in the trend calculation
Savitzky-Golay
Uses the lowpass filter known as Savitzky-Golay filter to smooth the RRi series and remove slow components from the tachogram
from hrv.detrend import sg_detrend

rri_detrended = sg_detrend(rri, window_size=51, polyorder=3)

fig, ax = rri.plot()
rri_detrended.plot(ax, color='k')