Analysis
Time Domain Analysis
from hrv.classical import time_domain
from hrv.io import read_from_text

rri = read_from_text('path/to/file.txt')
results = time_domain(rri)
print(results)

{'mhr': 66.528130159638053,
 'mrri': 912.50302419354841,
 'nn50': 337,
 'pnn50': 33.971774193548384,
 'rmssd': 72.849900286450023,
 'sdnn': 96.990569261440797,
 'sdsd': 46.233829821038042}
Frequency Domain Analysis
from hrv.classical import frequency_domain
from hrv.io import read_from_text

rri = read_from_text('path/to/file.txt')
results = frequency_domain(
    rri=rri,
    fs=4.0,
    method='welch',
    interp_method='cubic',
    detrend='linear'
)
print(results)

{'hf': 1874.6342520920668,
 'hfnu': 27.692517001462079,
 'lf': 4894.8271587038234,
 'lf_hf': 2.6110838171452708,
 'lfnu': 72.307482998537921,
 'total_power': 7396.0879278950533,
 'vlf': 626.62651709916258}
Non-linear Analysis
from hrv.classical import non_linear
from hrv.io import read_from_text
rri = read_from_text('path/to/file.txt')
results = non_linear(rri)
print(results)
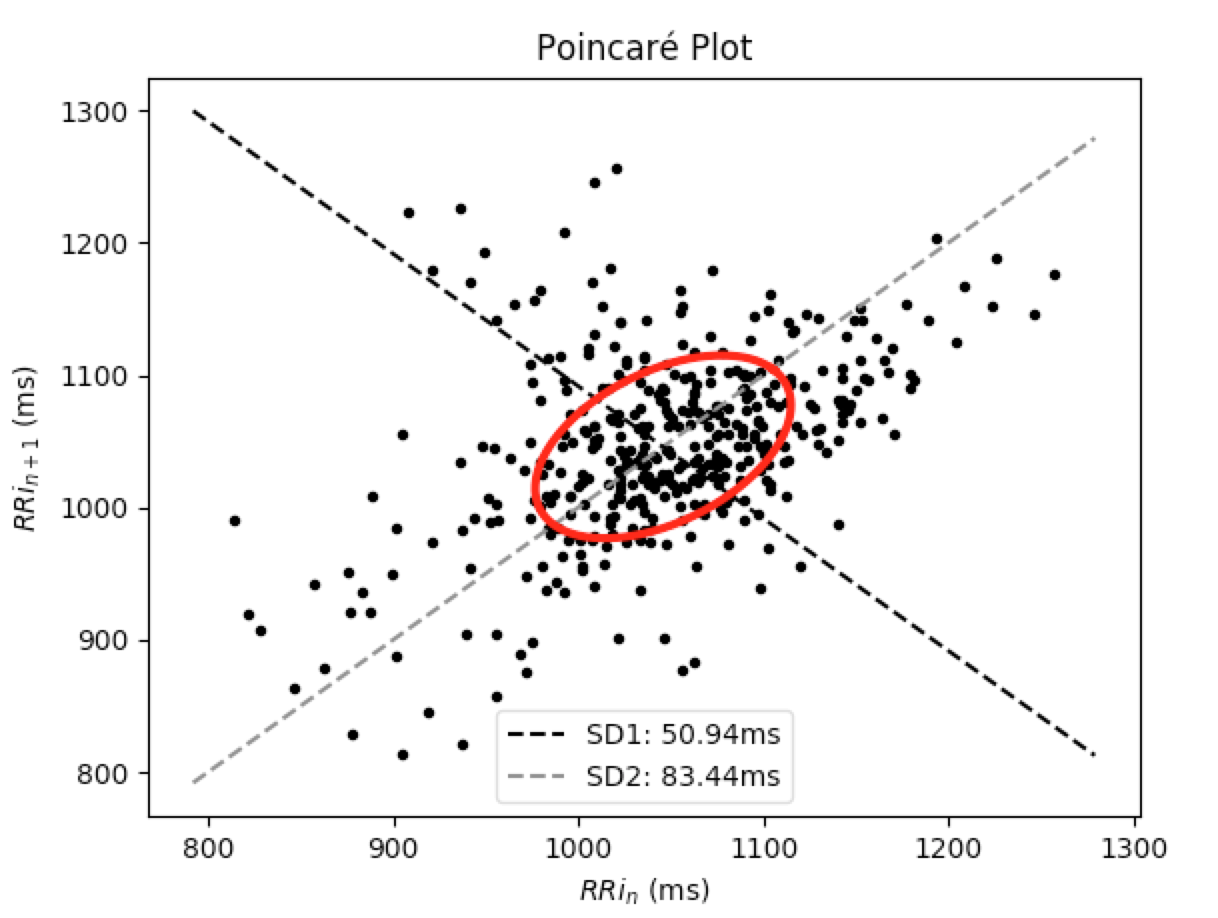
{'sd1': 51.538501037146382,
'sd2': 127.11460955437322}
It is also possible to depict the Poincaré Plot, from which SD1 and SD2 are derived:
rri.poincare_plot()